
What was initially supposed to be a graphing warm up, turned into one of the most AMAZING redefining activities I have taught. I have always thought of using the Numbers App with my Year 2 students but then dismissed it as it might be “too hard”. Well was I wrong!
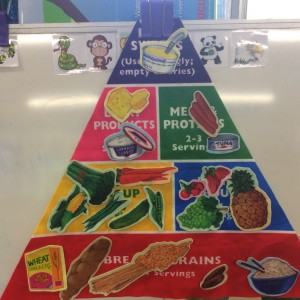
As a warm up the students were asked to look at the food pyramid and make a picture graph in Kidspiration using the “Food Group” template under the Science tab.
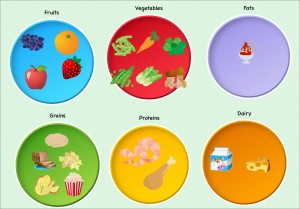
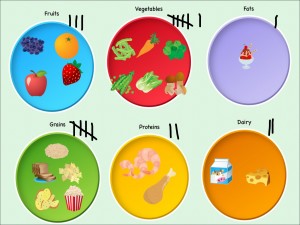
Students then exported their Kidspiration picture graph into the Blackboard to Write and Draw on iPad App to tally the food items in each food group.
From there students were going to use that information and make a bar graph using grid paper in their Maths books….HOWEVER, change of plan… I asked the students if they were keen to try something brand new, using an App they have never used before and were they willing to learn with me.
They all gave a determined ‘ YES!’.
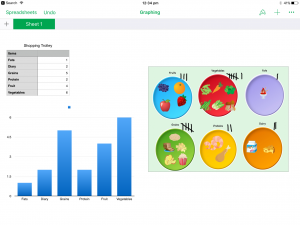
We inserted the Blackboard image into the Numbers App and made a table with the information we had. Great! That was easy. All kids were keeping up. Next we deleted any empty columns and rows. A little tricky for some. So the students who were quick to grasp the concept became “experts” and were available to help others.
From there ALL that you need to do is select the table and click the + to add a graph. It’s that easy!
The kids wanted to do another one. So, we read the book The Very Hungry Caterpillar and the students created a table of the amount of fruit the caterpillar ate, which they converted into a graph.

Now we could have stopped there… however we didn’t.
The students took a screenshot of their spreadsheet and inserted it into Explain Everything to answer: which fruit did the caterpillar like the most and how do you know that?
Give it a go!
![]()